
Debt is something many people deal with quietly. Borrowing is common, but the scale of debt across the UK is often underestimated. Conversations about money problems tend to stay private, even as rising costs and tighter household budgets make debt harder to manage.
At NDH Financial, we aim to reduce the stigma around debt and clear some of the confusion by sharing the latest UK debt statistics for 2025. The figures show how many people are in debt, how household budgets are coping, and where financial pressure is building most clearly.
To build this picture, we’ve brought together data from government departments, regulators, charities, and financial bodies like the Bank of England, Citizens Advice, and the Office for National Statistics.
Our Findings
- The average adult has £4,352 in unsecured debt.
- The average credit card balance is £1,900. At today’s interest rates, paying only the minimum can take over 7 years and cost almost double the amount borrowed.
- 1 in 14 people in England and Wales live in households that are already overspending or within £50 a month of doing so, with average shortfalls heading towards £396 a month.
- Insolvency reached its highest level since 2010, with one person entering insolvency every four minutes during Q3 2025 in England and Wales.
How many people are in debt in the UK?
Recent figures show that around 84% of UK adults have had some form of credit or loan within the past year. This includes mortgages, credit cards, personal loans, and other types of borrowing used as part of everyday finances.
When you strip out everyday consumer debt like student loans, money borrowed from friends or family, buy now pay later, and people who pay off their credit cards in full each month, around 48% of UK adults hold some form of credit or loan.
Given that the ONS estimated in 2024 that there are over 53 million people aged 20+ in the UK, that means there are roughly 25-26 million adults in the UK with ongoing credit or loans.
Average Debt Per Person in the UK
The latest figures show that the typical UK adult has £4,352 in unsecured debt made up of borrowing through credit cards, personal and payday loans, overdrafts and other credit.
This type of debt is growing, not shrinking. Consumer borrowing is increasing by over 8% a year, which shows that more debt is being added each year than before. Credit cards are driving much of this rise, as credit card borrowing alone is growing at around 12% a year, which is faster than any other type of consumer credit.
Average UK Household Debt
The average UK household has around £66,892 in total debt. Most of this debt is tied to housing. Mortgages make up the largest share, which is why households with higher incomes are more likely to hold larger debt balances overall.
Although household debt is lower than it was at its peak before the financial crisis in 2007-2008, it is still high when set against income. The household debt-to-income ratio is now just under 117%, so the average household owes more than a full year’s disposable income.
How many people are living with a negative budget in the UK?
A negative budget is when a household’s income is not enough to cover essential costs like housing, energy, food, and transport. When this happens, spending regularly is more than earnings, so there is no room for unexpected bills or rising costs.
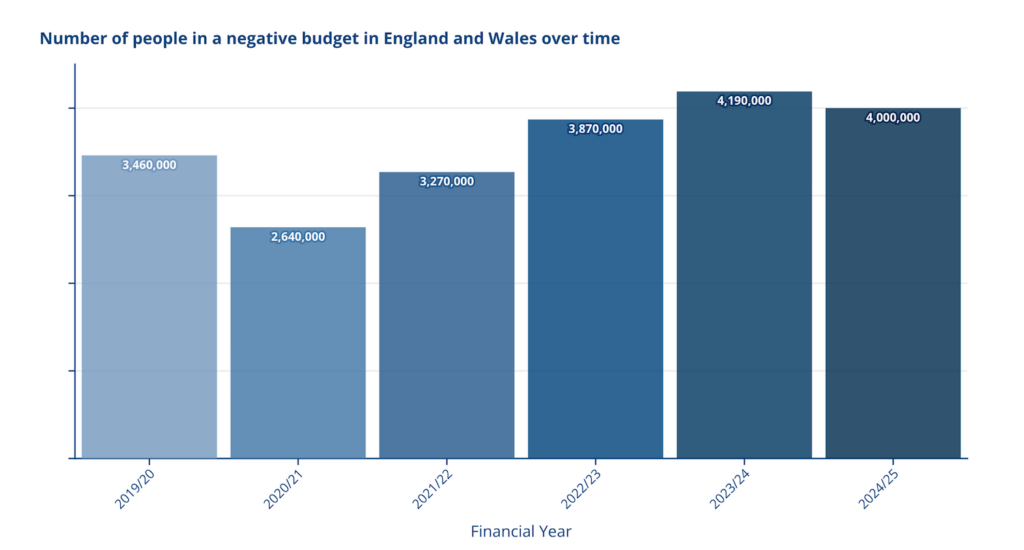
Source: Citizens Advice
The latest figures from Citizens Advice indicate that around 4 million people in England and Wales live in households where monthly spending exceeds income.
Beyond those already in difficulty, roughly 320,000 people are living in households that are less than £50 a month away from tipping into a negative budget.
When these figures are combined, it shows that around 1 in 14 people are either already overspending each month or very close to doing so.
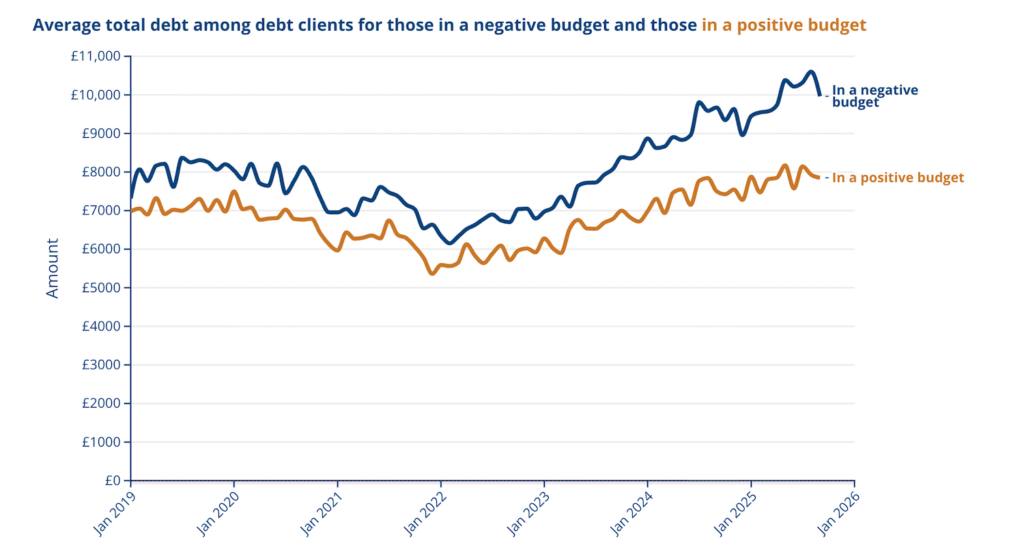
Source: Citizens Advice
The average debt for those living with a negative budget is likely to be higher than those with a positive budget, and this is predicted to get worse in 2026. Citizens Advice forecast that the average shortfall between income and essential spending for negative budget households will rise to around £396 per month.
These figures help explain why debt problems often snowball. When a household’s finances no longer balance, borrowing becomes a stopgap rather than a choice, and recovery becomes harder the longer the situation continues.
Average Credit Card Debt & Short-Term Borrowing
For many people, credit cards are a normal way to manage day-to-day spending. The average UK credit card balance is £1,900. If this balance is being repaid steadily or sits on a 0% interest deal, it may be manageable.
The picture changes when interest is high. With average credit card interest rates at 24.65% in 2025, a balance of £1900 costs around £468 a year or £39 a month in interest. If only minimum payments are made, it can take over seven years to clear the balance, and the total amount repaid can be close to double what was originally borrowed.
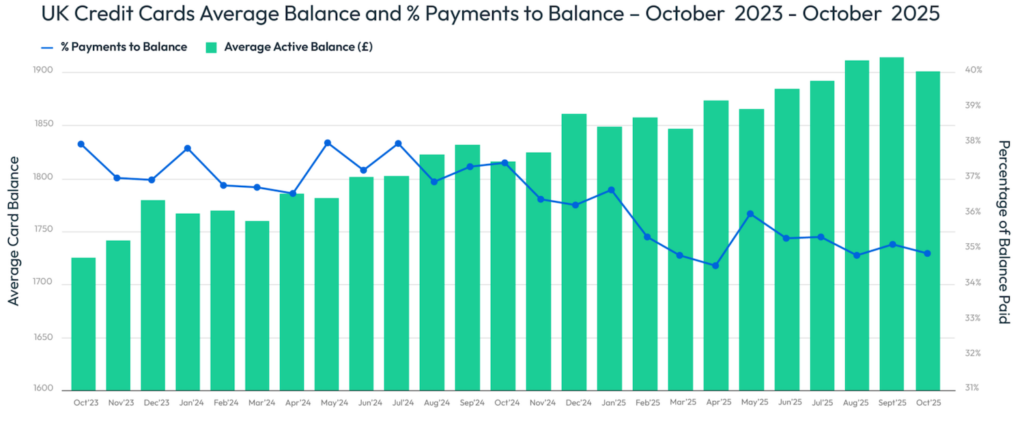
Source: FICO
Data from FICO shows that since mid-2024, on average, people have been paying back less of their credit card balance each month. This means more people are reducing their balances more slowly, allowing interest to build up over time.
When average balances stay high, it usually means credit cards are being used for regular, everyday costs, not only one-off purchases. Even when payments are made each month, interest can stop the balance from falling by much.
This pattern makes sense given the cost-of-living crisis. More households are using credit cards to fill gaps in their budget, which makes the debt harder to clear, especially while interest rates remain high.
Other short-term borrowing is increasing too, though at a slower pace. Growth in non-card consumer credit sits at around 6%, suggesting people are adding to existing balances rather than borrowing once and paying it back quickly.
County Court Claims & Debt Enforcement
County Court claims linked to unpaid debt have risen over the past year. Government figures show that between April and June 2025, there were 512,000 County Court claims, which is 23% higher than the same period in the previous year.
Most of these cases are money claims. These cover unpaid debts like gambling debt, catalogue debt, store card debt, utility bills, credit cards or other household borrowing. They do not relate to housing possession or eviction.
A County Court claim is usually issued after payments have been missed and attempts to recover the debt informally have failed. At this stage, the creditor is asking the court to confirm that the money is owed.
If the claim is successful and the debt is not dealt with, it can lead to a County Court Judgment (CCJ). A CCJ can then be followed by enforcement action, like bailiffs, deductions from earnings, or a charge being placed on a property.
Rising County Court claims suggest more debts are moving from arrears into the legal system. This often happens after a period of relying on credit cards or short-term borrowing to stay afloat, when repayments become harder to manage.
Mortgage & Landlord Possession Statistics
During the pandemic, mortgage and landlord possession action was heavily restricted to give people breathing space while many were furloughed or dealing with sudden income loss. Since then, figures from the Ministry of Justice show that possession activity has returned to near pre-pandemic levels.
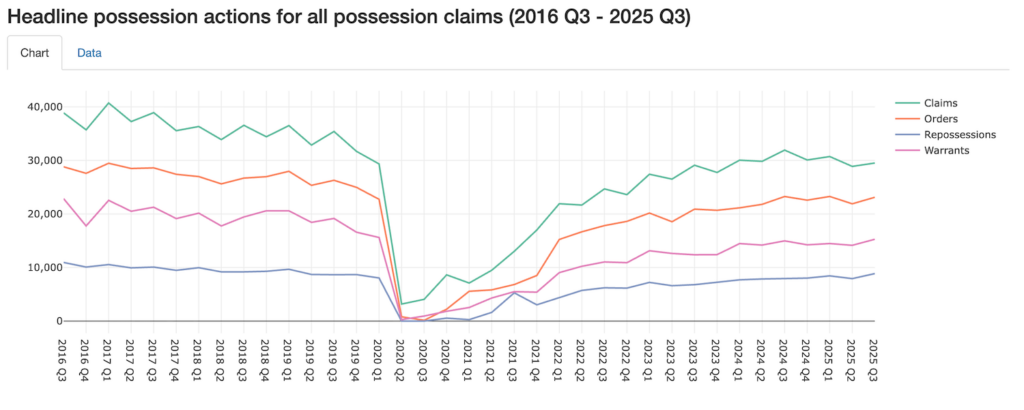
Source: Ministry of Justice
These possession statistics cover several different stages:
- Possession Claim: When a lender or landlord applies to the court because payments have been missed. No decision has been made at this point.
- Possession Order: Issued if the court agrees the claimant can take possession, often giving time for arrears to be addressed.
- Warrant of Possession: Allows enforcement to take place if the order is not followed.
- Repossession or Eviction: When the property is actually taken back.
Most cases never reach the final stage, but each step brings increasing pressure and uncertainty for the household involved.
Behind these figures are people dealing with the stress of possible eviction or repossession. Even early-stage action can create uncertainty about where someone will live, how they will manage financially, and what happens next.
Which areas of the UK are most affected by possessions?
Possession activity is not spread evenly across the UK. Some areas have far higher levels of landlord and mortgage action than others, which reflects differences in housing costs, rent levels, and household income.
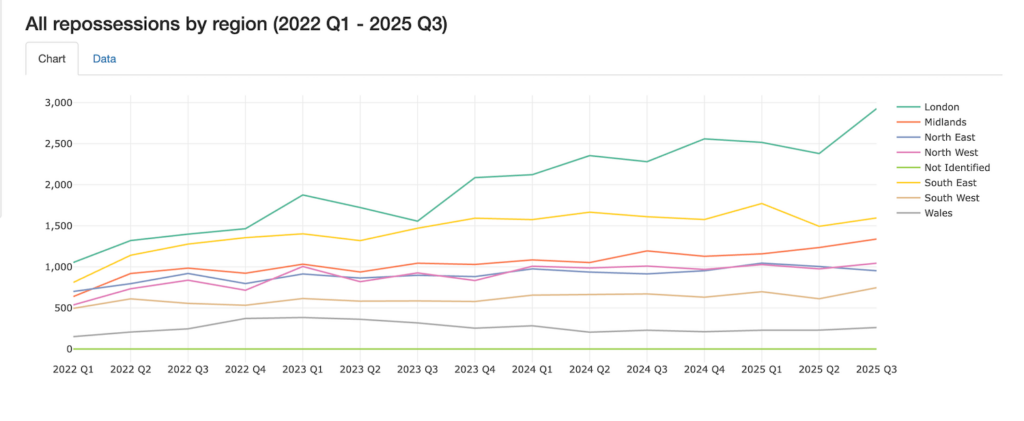
Source: Ministry of Justice
Areas with high rents and many private renters, like London and the South East, are more likely to see possession cases. When rents rise, tenants in these regions have little spare money to fall back on. Even a short drop in income or a small increase in their cost of living (eg, rising energy bills) can push their budgets over the edge.
Individual Insolvency Statistics in the UK
Insolvency is a formal legal process used when someone can no longer repay their debts in the normal way. Insolvency is usually reached after a period of missed payments, court action or growing arrears, rather than as a first step.
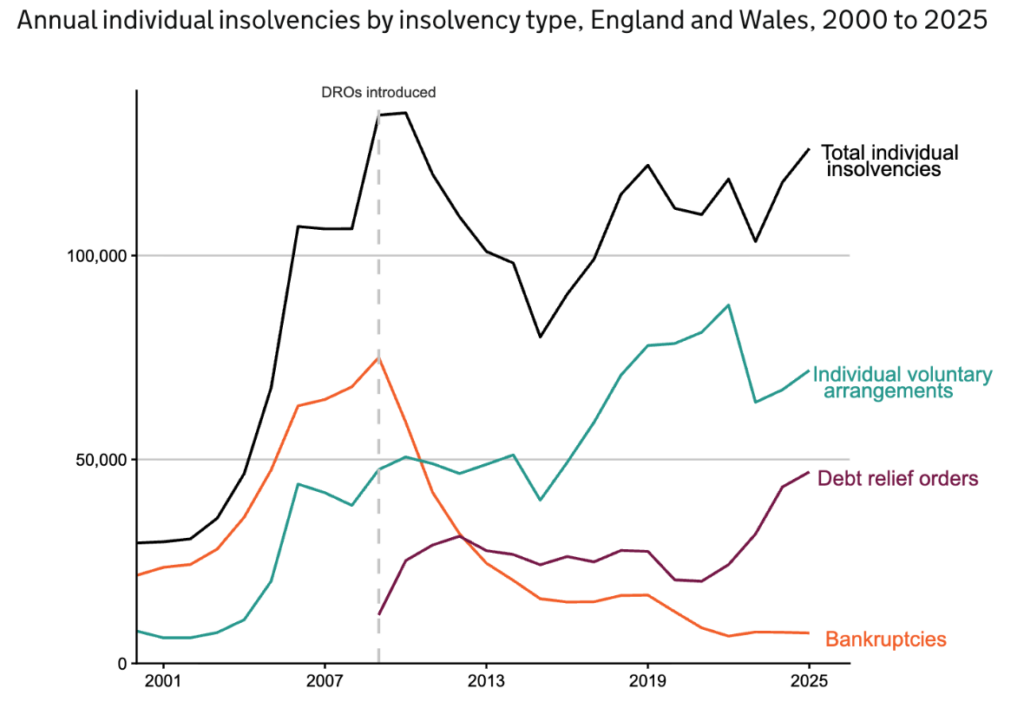
Source: Insolvency Service
In 2025, the total individual insolvencies increased again, showing that more people are reaching the point where their debts are no longer manageable.
The latest data shows that across England and Wales:
-
- There were 126,240 individual insolvencies registered in 2025. This was 7% higher than in 2024 and the highest annual total since 2010. This works out at around 1 in every 395 adults entering insolvency during the year.
- Debt Relief Orders (DROs) reached their highest annual level since their introduction in 2009.
- Bankruptcy numbers were slightly lower than in 2024 and remain well below pre-2020 levels.
- IVAs increased compared with 2024, though they remained below the unusually high levels seen between 2019 and 2022.
- 89,130 Breathing Space protections were registered, a similar level to 2024 and the highest annual total since the scheme began in 2021.
The latest statistics from the House of Commons also show there are differences across the UK:
- Scotland recorded 1,780 individual insolvencies in Q3 2025, down 6% on the year.
- Northern Ireland recorded 149 individual insolvencies in Q3 2025, a 48% increase compared with the previous year, though from a smaller starting point.
- England and Wales recorded 33,559 individual insolvencies in Q3 2025, which is 14.7% higher than in Q3 2024. That works out as roughly 1 person every 4 minutes during Q3 2025.
UK Debt Statistics Search Trends
With the cost of living crisis continuing and average levels of personal debt rising, it’s no surprise that more people are turning to the internet for answers. Google Trends shows an increase between 2024 and 2025 in searches for terms such as credit card debt, bailiffs, and insolvency, suggesting growing concern about debt and its consequences.
There has also been a rise in searches for phrases like debt solutions UK, debt management, IVA, and how to write off debt UK. This points to people trying to understand their options and take action earlier, before their situation becomes unmanageable.
Taken together, these search trends reflect the wider data in this report. As financial pressure builds, more people are looking for ways to regain control before debt reaches the courts or the insolvency stage.
All data used in this blog refers to the UK unless stated otherwise. Where figures differ for Scotland or Northern Ireland, this is clearly flagged. Data is correct at the time of writing. The information provided is for general guidance only and does not constitute financial advice.